Charts, Graphs & Reports
Alcohol use among teens maintained historic lows in 2012, continuing a long-term gradual decline.
 New study reveals the 7 best ways to keep your teens from drinking
Diving into the latest data about alcohol use by 12 to 17-year-olds reveals the seven habits of parents whose kids don’t drink or drink far less frequently than others. The Substance Abuse and Mental Health Services Administration (SAMHSA) released the details of their 2011 National Survey on Drug Use and Health…[more]
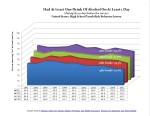
 1991-2012 Trends in Alcohol Use by Grade (8th, 10th and 12th Grades)
Down, down, down. Over the past twenty years, alcohol use by 8th, 10th and 12th graders has dropped and has continued to drop by astounding amounts. These results are from the December 2012 Monitoring the Future (MTF) survey which is conducted annually…[more]
 1991-2011 Trends in Alcohol Use by Grades 9 through 12
While the 2011 YRBSS report confirms that high school students’ alcohol use is still on the decline, this study’s data is not as dramatic or as positive as the other recent studies were. The biggest news is that, for the first time in the history of this study, the majority of high school students…[more]
 1991-2012 Trends in Binge-Drinking or Extreme Alcohol Use by Grade (8th, 10th and 12th Grades)
Even with the good news that alcohol use is way down among all middle and high-school grades, any binge-drinking is too much. Binge-drinking is defined as having five or more drinks in one sitting. It’s an objective measure. We’re glad to see only 5 percent of 8th graders report binge drinking. It once was as high as…[more]
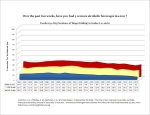
 1991-2011 Trends in Binge-Drinking or Risk-Taking by Grades 9 through 12
While all agree that any risky behavior while drinking is unwelcome, including the underage drinking itself, it’s nice to report that all of the following behaviors are at historic lows: binge drinking, drinking and driving, riding in a car with someone else who drank and trial of alcohol before age 13. The 2011 YRBSS data isn’t as encouraging as the 2011 MTF results which indicate a lower level of …[more]
 2001-2010 Trends in Alcohol Use and Recency by Age (12-17 Years Old)
More good news! Although the Substance Abuse and Mental Health Services Administration (SAMHSA) approaches underage alcohol use from a different angle than the other studies, the trend data from their report, The National Survey on Drug Use and Health, is basically the same: usage and recency (the last time one had a drink) continue to fall among…[more]
 1992-2010 Trends in Alcohol Use by College Students
It’s important to recognize that the college student data from Monitoring the Future includes students who are legally allowed to drink because they are 21 or older. We can assume that approximately one-quarter of the respondents are of age. Therefore, more students are expected to…[more]


Hello! I’m at work browsing your blog from…! Just wanted to say I love reading your blog and look forward to all your posts! Keep up the excellent work!
I really enjoy your websites at http://socialhostlaw. wordpress.com/statistics/charts-graphs-reports/! Nice facts that is related to this subject, thanks so much for posting about it.